Why Crypto Is Up: Oil, a 45-Week Line, and $648M of Squeezed Shorts
In This Article
Introduction
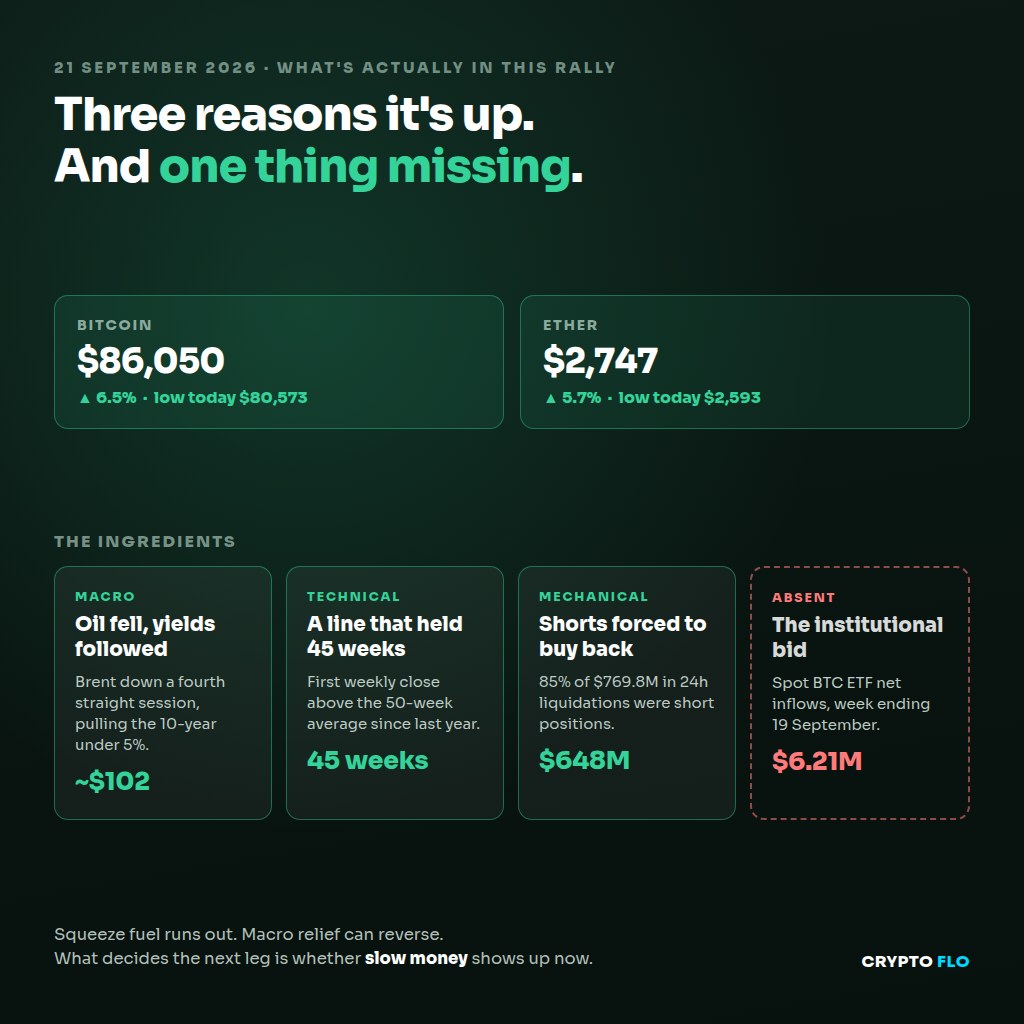
Bitcoin is trading around $86,050, up roughly 6.5% on the day after a low of $80,573. Ether is near $2,747, up about 5.7%. Six days ago Bitcoin was under $76,000.
So: why?
There are three real answers, and they stack. There is also a fourth thing — something notably absent from this rally — which matters more for what happens next than any of the three reasons it happened.
All figures here are live as of 21 September 2026. Prices move; the mechanics are the part worth keeping.
Reason 1: Oil fell, and yields followed it down
The least crypto-sounding reason is probably the most important.
Brent crude fell for a fourth consecutive session, to around $102 — its longest losing streak in three months. Falling energy prices cool inflation expectations, and cooling inflation expectations pull bond yields down with them. The US 10-year Treasury yield dropped below 5%.
That chain matters to crypto for a reason that has nothing to do with blockchains.
When the risk-free rate falls, two things happen at once. Holding a non-yielding asset becomes less costly in opportunity terms — if Treasuries pay less, the bar an alternative has to clear is lower. And falling yields generally loosen financial conditions, which historically supports risk assets broadly, crypto among the most sensitive of them.
This is the macro layer, and it explains why the move was broad rather than coin-specific. When Bitcoin and Ether rise together by similar percentages on the same day, that is usually a macro signature rather than anything happening on-chain.
Reason 2: A line that had held for 45 weeks
Bitcoin closed the week ending 20 September at $81,159, above its 50-week moving average of roughly $78,786.
That was the first weekly close above that level in 45 weeks.
Long-horizon moving averages are widely watched by trend-following funds and systematic strategies, which means a decisive break tends to generate mechanical buying independent of anyone's opinion. It is partly self-fulfilling — the level matters because enough capital treats it as mattering — but self-fulfilling is not the same as meaningless. Flows are flows.
Worth being precise about what this does and does not tell you. A weekly close above a long-term average is evidence that the downtrend has paused. It is not evidence about where price goes next. Those are different claims, and coverage this week has been blurring them enthusiastically.
Reason 3: The short squeeze, which is the biggest single piece
Here is where most of the day's actual movement came from.
In the last 24 hours, roughly $769.8 million in positions were liquidated across 115,490 traders. Of that, about 85% were short positions — around $648 million of bets against the market, force-closed.
If you read our piece on liquidation cascades, this is that machinery running in reverse.
A trader who is short has borrowed and sold, and must buy to close. When price rises past the level where a short position's collateral runs out, the exchange closes it automatically by buying at market. That buying pushes price higher. Higher prices trigger the next tier of shorts. Each round of forced buying manufactures the conditions for the next.
So a meaningful share of today's green candle is not people deciding Bitcoin is worth more. It is people who bet against it being compelled to buy it back, at whatever price was available, whether they wanted to or not.
That is not a criticism of the move. Squeezes are a real and recurring feature of leveraged markets, and the prices they produce are real prices. But it is a different thing from fresh demand, and it behaves differently afterwards, which brings us to the part almost nobody is mentioning.
What is missing from this rally
The institutions did not show up.
Spot Bitcoin ETFs recorded a net inflow of roughly $6.21 million for the week ending 19 September. Not billion. Million. On a product complex that has moved billions in a single week this year, that is functionally zero.
Bitcoin ran from under $76,000 to $86,000 without the institutional bid that has driven most of the significant repricings since spot ETFs launched.
There are two ways to read that, and honest people can hold either.
The constructive read: the move happened despite no institutional participation, which means the bid is still to come. If allocators follow price — and they often do, since mandates and committees move slowly — then the flows arrive after the move, not before, and there is fuel left.
The cautious read: rallies built on short liquidations and macro relief have a specific shape. Squeeze fuel is finite. Once the shorts are cleared out, the forced buying stops, and price then has to be supported by people who actually want to own the asset at the new level. If that spot demand does not materialise, the move gives back ground as quickly as it was made.
Which read is right gets settled by flow data over the next week or two, not by argument.
Is this the start of a bull run?
Bitcoin gained roughly 44% in the third quarter, which is the sort of number that gets that question asked.
The honest answer is that the ingredients are mixed in an unusual way. The macro tailwind is real and not mechanical — falling yields are a genuine change in conditions, not a positioning artefact. The technical break is real, though partly self-reinforcing. The squeeze is real but by nature temporary.
What is not yet present is the thing that made previous legs durable: sustained spot accumulation by large, slow buyers. Until that shows up in the flow numbers, this is best understood as a positioning-driven move on a macro tailwind, not an allocation-driven one.
That distinction is not pessimism. It just tells you which data to watch.
What to watch next
- ETF flows, weekly. The single most informative number. A shift from $6 million to hundreds of millions would change the character of this entirely.
- Whether the 50-week average holds as support. Breaking above a level and then holding it on a retest are two different tests. The second one is the one that counts.
- Funding rates and open interest. If funding flips sharply positive and open interest climbs, leverage has simply reloaded on the long side — which sets up the mirror image of today, in the other direction.
- Oil and the 10-year. These were the trigger. If crude reverses and yields push back above 5%, the macro support that started this goes with it.
Frequently Asked Questions
Q: Why is crypto up today?
A: Three things at once. Oil fell for a fourth straight session to around $102, pulling the US 10-year Treasury yield below 5% and loosening financial conditions. Bitcoin closed a week above its 50-week moving average for the first time in 45 weeks. And roughly $648 million of short positions were force-closed, which mechanically creates buying.
Q: What is a short squeeze?
A: Traders betting on a price fall must buy to close their positions. When price rises past their liquidation level, the exchange buys for them automatically, which pushes price higher and triggers more shorts. It is the same forced-liquidation machinery that drives crashes, running in the opposite direction.
Q: Did institutions drive this rally?
A: No. Spot Bitcoin ETFs saw a net inflow of only about $6.21 million for the week ending 19 September, which is effectively zero for that product complex. This move happened without the institutional bid that has driven most major repricings since spot ETFs launched.
Q: Does bitcoin closing above its 50-week moving average mean the bear market is over?
A: It means the downtrend has paused, which is not the same as a new uptrend beginning. Long-term moving averages attract systematic buying when broken, so the level has real effects, but a single weekly close is evidence about the past rather than a forecast.
Q: Why do oil prices affect crypto?
A: Indirectly, through rates. Falling energy prices cool inflation expectations, which pulls bond yields down. Lower yields reduce the opportunity cost of holding non-yielding assets and loosen financial conditions generally, which tends to support risk assets including crypto.
Q: Will this rally continue?
A: Nobody knows, and the composition of the move is the thing to watch rather than the size of it. Squeeze-driven buying is finite by nature, so the question is whether genuine spot demand appears once forced buying is exhausted. ETF flow data over the coming weeks will answer it better than any prediction.
The Bottom Line
The market is up for three reasons that are all genuine: a macro tailwind from falling oil and falling yields, a technical break that had not happened in 45 weeks, and a large short squeeze that mechanically forced buying.
The most useful observation is not any of those. It is that this happened without institutional flows. A move of this size with $6 million of ETF inflows behind it is a market repricing on positioning and macro, not on new allocation.
That can absolutely be the start of something — slow money often follows price rather than leading it. But it means the next two weeks of flow data matter more than the last two days of candles. Watch what the large buyers do now that the move has already happened.
This content was created with AI assistance and may contain errors. Prices and market data move constantly — figures here are a snapshot from 21 September 2026 and should be verified before use. Nothing here is a prediction or a recommendation. Not financial advice. Always do your own research before making any investment decisions.
Frequently Asked Questions
Why is crypto up today?
Three things at once. Oil fell for a fourth straight session to around $102, pulling the US 10-year Treasury yield below 5% and loosening financial conditions. Bitcoin closed a week above its 50-week moving average for the first time in 45 weeks. And roughly $648 million of short positions were force-closed, which mechanically creates buying.
What is a short squeeze?
Traders betting on a price fall must buy to close their positions. When price rises past their liquidation level, the exchange buys for them automatically, which pushes price higher and triggers more shorts. It is the same forced-liquidation machinery that drives crashes, running in the opposite direction.
Did institutions drive this rally?
No. Spot Bitcoin ETFs saw a net inflow of only about $6.21 million for the week ending 19 September, which is effectively zero for that product complex. This move happened without the institutional bid that has driven most major repricings since spot ETFs launched.
Does bitcoin closing above its 50-week moving average mean the bear market is over?
It means the downtrend has paused, which is not the same as a new uptrend beginning. Long-term moving averages attract systematic buying when broken, so the level has real effects, but a single weekly close is evidence about the past rather than a forecast.
Why do oil prices affect crypto?
Indirectly, through rates. Falling energy prices cool inflation expectations, which pulls bond yields down. Lower yields reduce the opportunity cost of holding non-yielding assets and loosen financial conditions generally, which tends to support risk assets including crypto.
Will this rally continue?
Nobody knows, and the composition of the move is the thing to watch rather than the size of it. Squeeze-driven buying is finite by nature, so the question is whether genuine spot demand appears once forced buying is exhausted. ETF flow data over the coming weeks will answer it better than any prediction.
Let AI summarize these channels for you daily
Pick your favorite crypto YouTube channels and news sites. Get a 5-minute AI brief every morning.
Choose Your Sources